









Food and Beverage Industry

In food and beverage, what you lose isn't machine time — it's raw material you'll never get back.

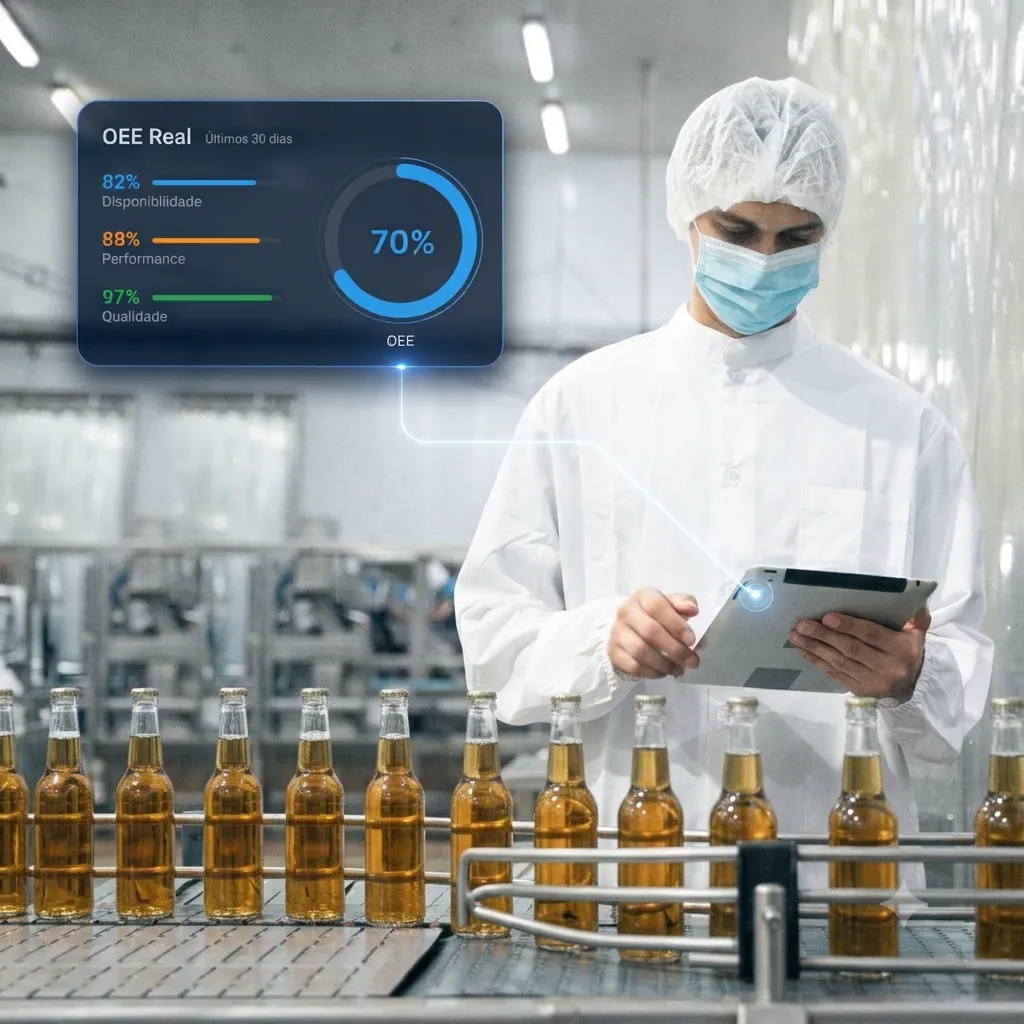
In this segment, what determines the outcome isn't machine availability — it's how many bottles, liters, or units come off the end of the line. And the bottleneck is rarely where you'd expect: often it's the simplest piece of equipment on the line, not the most expensive one, that's holding back everyone else's volume. Cogtive shows the entire line's flow in real time, from filling to palletizing, and where that volume is being lost.

Food and beverage industry — Cogtive OEE
Food & beverage segment clients

F&B companies that trust Cogtive

Products for food and beverage

From filling to palletizing — your line's real volume

Micro-stops, speed variations, and the bottleneck hidden in the simplest machine on the line drain volume without ever showing up in a spreadsheet. Cogtive captures every event and shows you where the line is losing volume — and why.

01 · OEE

Your line's real volume, not just whether the machine was running

In food and beverage, a line can stay available for the entire shift and still deliver fewer bottles, liters, or packages than it should — because of speed variations, small stops, and adjustments a spreadsheet never captures. Cogtive shows the real volume produced by line and by SKU, not just whether the machine was running.

Performance and Quality carry more weight than Availability in this segment — that's where the missing volume shows up at the end of the shift.

With visibility into micro-stops and standardized time per SKU, one line went from 37% to 66% OEE in nine months — more than 29 points of efficiency recovered with no new investment in equipment.

Real volume by line and by SKU, not just machine availability
Captures micro-stops and speed variations a spreadsheet never records
Bottleneck identified even when it isn't the most sophisticated equipment on the line
Explore OEE
02 · Smart Setup

Faster product changeovers, without losing volume on the next batch

Every flavor, bottle, or packaging changeover that takes longer than it should is volume the line failed to produce. Smart Setup replaces paper checklists with a step-by-step digital guide on the operator's tablet, standardizing setup time regardless of shift or who's operating.

The Ramp-Up report tracks the line's performance in the first hours after the changeover, confirming the setup was done correctly before it turns into rework or an out-of-spec batch.

Step-by-step digital guide replaces paper checklists
Standardized setup time, regardless of shift
Monitored Ramp-Up after every product changeover
Explore Smart Setup
03 · AI Vision

Computer vision to catch quality loss before it becomes scrap

In food and beverage, a deviation that goes unnoticed on the line — an out-of-spec fill level, a crooked label, damaged packaging — turns into a return, rework, or a total batch loss. AI Vision uses computer vision to identify these quality deviations in real time, right on the line, without relying on manual sampling inspection.

At manual workstations — inspection, packaging, kit assembly — AI Vision also tracks the station's pace and identifies productivity drops and idle time with no manual logging.

Quality deviations identified in real time, right on the line
Reduces reliance on manual sampling inspection
Extends OEE to manual stages with no sensor on the equipment
Explore AI Vision
04 · Pace and Flow

The entire line, visible end-to-end — not just machine by machine

Not every question is "is this machine stopped?" In food and beverage, what matters is whether the production pace matches the shift's target, and where on the line — from filling to palletizing — the real bottleneck is.

Pace Management shows whether each line is running at the pace needed to hit expected volume. Flow View shows where each batch is in the flow, automatically identifying which stage is holding back the others before the delay reaches the customer.

Production pace tracked against the shift's volume target
View of the entire line — filling, labeling, packaging, palletizing
Bottleneck identified automatically, even outside the obvious equipment
Explore Flow View

Production Management System

Real-time OEE

production active
82%Avail.
AvailabilityProductive time ÷ planned time
78%Perf.
PerformanceActual speed ÷ ideal speed
94%Qual.
QualityGood parts ÷ total parts
Total OEE · Line 02 60%
live

Hover over this section to pause the video and watch OEE drop

Why Cogtive

Why Cogtive for food and beverage?

High-speed lines, frequent product changeovers, and short production windows leave little room for inefficiency. Cogtive sees every micro-stop and pace variation in real time — and turns that data into action within the same shift.

Your line's real volume — not what the spreadsheet shows

30-second micro-stops disappear in Excel but destroy the line's real volume. Cogtive automatically captures every event and shows how many bottles, liters, or units the line actually delivered — not just whether the machine was available.

Faster product changeovers, without losing volume on the next batch

Smart Setup replaces paper checklists with step-by-step digital guides on the operator's tablet — reducing setup time and ensuring every changeover follows the correct standard, regardless of shift.

Bottlenecks identified even in the simplest machine on the line

Flow View shows in real time where each batch is in the flow — filling, labeling, secondary packaging, palletizing — and automatically identifies which stage is holding back the others, even when it isn't the most sophisticated equipment on the line.

Support for both continuous and batch lines

Whether it's a continuous beverage line or a batch food process, Cogtive calculates the real volume and performance for each type of operation — with no distortions in the metrics, beyond just machine availability.

Automatic alerts for stoppages and deviations

Set up notifications via email, Teams, or Slack when a line exceeds the standard downtime or when performance drops below target — your team acts in the same shift, not the next day.

Zero spreadsheets — data collected on the shop floor

Operators log directly on the tablet, or IoT sensors collect data automatically. Metrics update in real time, with no need to wait until the end of the shift to know what happened in production.

Results

Numbers that prove the impact on your operation

0M

in savings generated for clients

+0%

increase in production capacity

0%

reduction in lead time

0×

return on investment

+0%

increase in equipment availability

0months

payback per industrial unit

Blog

Content on OEE, production management
and operational excellence

Visit the Blog
Improving OEE: 5 Essential Performance Metrics blog

Improving OEE: 5 Essential Performance Metrics

In the manufacturing industry, continuous performance improvement is crucial to achieve operational efficiency and competitiveness. Moreover, it is important to consider that there are specific metrics that can guide this process. One essential metric for evaluating production efficiency is OEE, which stands for Overall Equipment Effectiveness. This metric measures resource utilization and production quality. In […]
OEE: Understand one of the productivity indicators for Industry 4.0 blog

OEE: Understand one of the productivity indicators for Industry 4.0

Industry 4.0 is characterized by the use of advanced technologies and connectivity to increase efficiency, productivity, and quality in manufacturing. In this context, measuring indicators is essential to identify areas for improvement and make data-driven decisions. Additionally, one of the most important indicators for Industry 4.0 is OEE, which stands for Overall Equipment Effectiveness. What […]

Ourofino Saúde Animal invests in AI and increases production capacity by almost 30% blog

Ourofino Saúde Animal invests in AI and increases production capacity by almost 30%

Although dealing with idle capacity is common in the industrial environment, here we are going to talk about hidden capacity, which involves a comprehensive analysis of lead times and production bottlenecks throughout the factory, and not just individual equipment. This approach allows for the identification of various improvement opportunities that go beyond simply maximizing equipment […]

Ready to take the next step?
Contact us to schedule a meeting.

X