OEE from 37% to 66% in 2024: how Sandéleh stabilized its packaging line
Jar collisions kept stopping Sandéleh's packaging line. With OEE and Flow View, the team found the cause, redesigned the conveyor and took line OEE from 37% to 66% in 2024.
- 37% → 66%
- line OEE, January to September 2024
- 200 → 560
- jars of conveyor buffer capacity
- ~15 → 3–5 min
- wait for a maintenance technician
The challenge
Sandéleh Alimentos has been in the market since 2005. Based in Sorocaba, in the interior of São Paulo state, the company has around 250 employees and more than 5,000 customers across Brazil and Latin America. Its portfolio spans more than 10 families of preserved foods, packaged in Sorocaba and distributed through branches in Belo Horizonte, Rio de Janeiro and Paraná. The challenge was to raise production efficiency without compromising the product quality the brand is known for.
Management and operators lacked the transparency to build action plans that reached the root cause of problems. Efficiency was tracked in Excel spreadsheets that missed relevant events such as microstops and performance variations, so the OEE figure left out part of the losses. Without real-time data, fast and well-grounded decisions were hard to make.
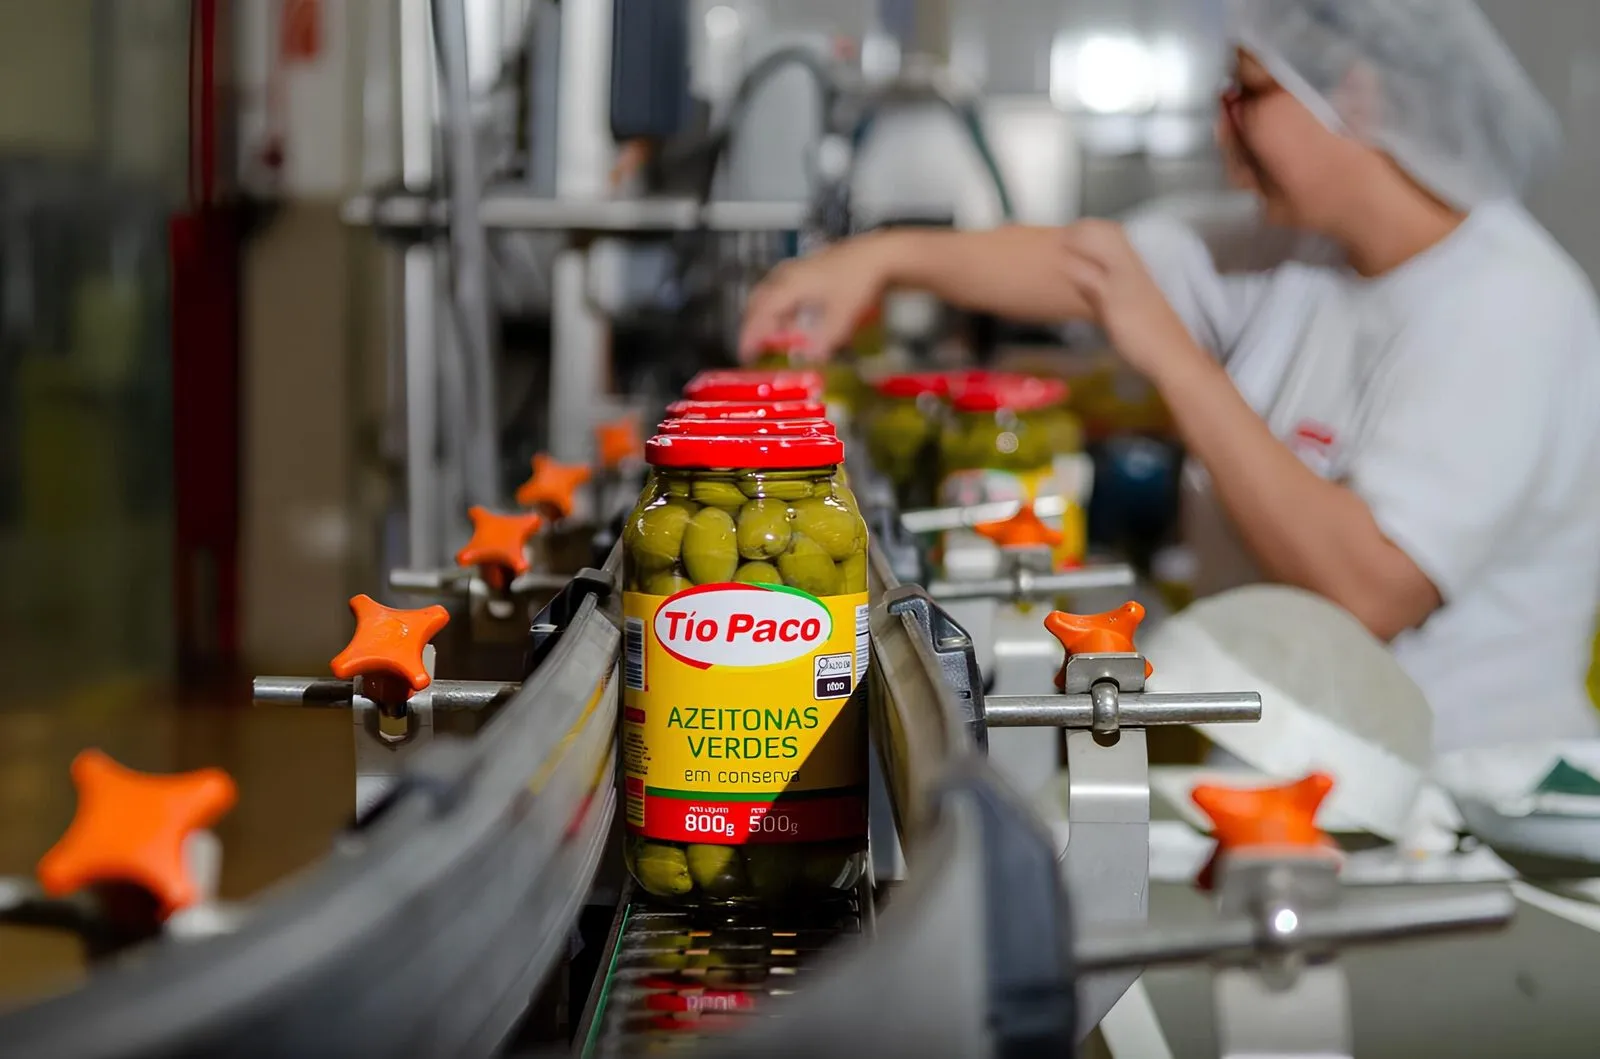
One problem stood out on the jar line. The conveyor had too little space, which put pressure on the grouping gate. When the gate opened, more jars than necessary passed through and collided at the jar grouper. Monitoring showed the packaging machine was one of the line’s main stoppage points. Even with a high-throughput machine, the conveyor could not absorb the jars whenever a small interruption occurred, and the whole line had to stop.
After evaluating several providers, Sandéleh chose Cogtive to make the shop floor visible.
The solution
Downtime is now logged digitally and displayed in real time. The team works with two parts of the Cogtive platform. The OEE foundation provides dashboards and an equipment timeline to assess performance. Flow View shows how each batch behaves as it moves through the stages of the line. Together they show where performance is lost and point the team to the root cause of each stoppage. Cogtive’s team trained the Sandéleh team to work with both.
Conveyor redesign. A detailed analysis led to a significant change on the conveyor. Its capacity rose from approximately 200 jars to 560 jars, an increase of around 180%, which gives up to five minutes of buffer for technical adjustments before the line stops. The conveyor was also reshaped into a more tapered configuration, so the pressure of accumulated jars is distributed instead of transferred straight to the gate. Operation is more stable and unnecessary interruptions are avoided.
Standard work. The data showed that the speed of the previous conveyor was not aligned with the capacity of the next machine in line. With Cogtive, the team detected the mismatch and defined a standard speed for the process as a whole. Targets were set, and failure logging was revised: stoppages used to record only which part of the machine failed, and each failure is now linked to its actual root cause. Production times were standardized for each SKU, where they had previously varied without control.
Daily decisions on shared data. The team holds daily meetings with production planning and control (PPC), production, maintenance and quality, using real-time data to identify and solve problems quickly.
The results
The evolution of OEE tells the story. In January 2024, the line was operating at 37%. With the improvements in place and continuous use of Cogtive, it reached 53% in May and 66% in September of the same year.
Other gains are now measured rather than assumed:
- Conveyor buffer: from approximately 200 to 560 jars, with up to five minutes to make adjustments before a stoppage.
- Maintenance response: the wait for a maintenance technician fell from around 15 minutes to 3 to 5 minutes.
- Microstops under control: small interruptions that used to go unnoticed are now visible, which made it possible to reduce setup, cleaning and adjustment times and make the operation more predictable.
Beyond stability and productivity on the line, the project built a culture of continuous improvement in which decisions start from reliable data.
What’s next
The goal now is to sustain the gains and expand on them, pursuing new optimization opportunities to raise efficiency further. The plan includes expanding monitoring, adding new sensors and training operators continuously.